Microarray technology helps us to figure out the difference in expression of thousands of genes in the cell for two or more distinct conditions. Almost all analysis studies try to catch a glimpse of the relations between differentially expressed genes.
In a PATIKA graph, there exists upregulating and downregulating paths between molecular states. Upregulating paths contain even number of inhibition relations on the path, while downregulating paths contain odd number of inhibition relations (Figure 1).
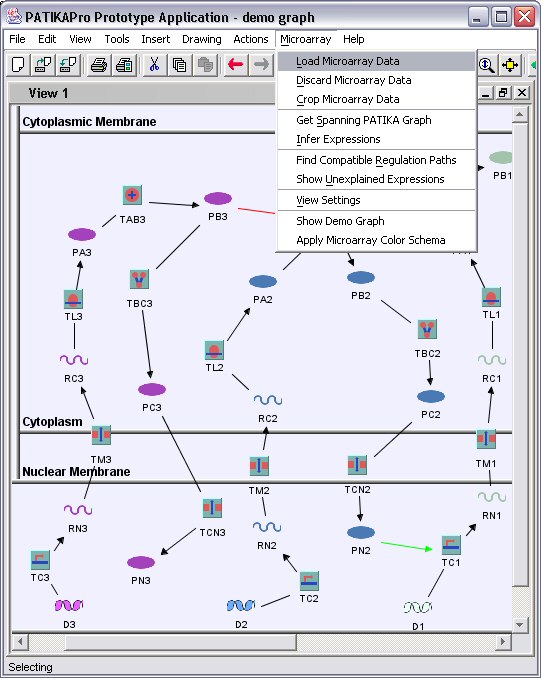
When a microarray data is loaded onto an existing PATIKA graph, the data of differentially expressed genes are simply associated with the RNA states in the PATIKA graph, since this data is a measure of RNA levels in the cell. Then PATIKApro editor supplies users several tools to inspect the possible relations between differentially expressed genes, making use of the existing upregulating and downregulating relations between molecular states.
Activity Inference
Given the PATIKA graph and a related microarray data, PATIKApro editor checks for all possible dependencies between expressions and highlights possible paths whose differential activity may explain these expressions. PATIKApro uses a new algorithm to solve this problem. It is based on DFT (Depth First Traversal) but modified to handle different regulation relations between states and cyclic paths (a simple case is shown in Figure 2).
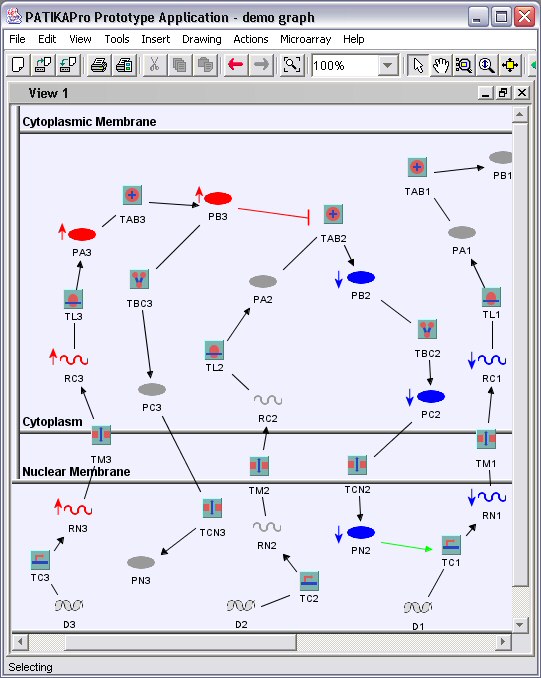
Viusalization and Client Side Queries
The editor uses color coding, highlighting and labeling for the display of the inferece results and other queries. The user may focus on one protein and query the possible effects of/on others. Or may navigate trough the dependencies of genes.
Server Side Queries
The size of the PATIKA graph in the editor may not be comprehensive enough for an efficient analysis, or there may be no graph at all. In these situations, the user may query the server side for a related part of the cellular network. PATIKApro editor has the facility to send the gene names in the expression data to the server and retrieve a related PATIKA graph. Alternatively, the graph may be extended by neighborhood queries, etc.
Reference
O. Babur, E. Demir, A. Ayaz, U. Dogrusoz, O. Sakarya, "Pathway Activity Inference Using Microarray Data", technical report, Bilkent Center for Bioinformatics (BCBI), 2004.